Understanding Resolve Actions Express LIVE
Introduction
Resolve Actions Express LIVE is the Resolve Actions Express dashboard page. It displays events and alerts from the control and monitoring systems. The dashboard is a dynamic environment responding to changes in real time.
The Actions Express LIVE dashboard is illustrated in the following figure:

It provides a central display of changes: open incidents, running workflows, real-time KPIs and statistics. You also use it to manage critical events and take action to prevent degradation of critical operations and services.
In the dashboard, two real time displays are accessible from the two top left hand tabs, Open Incidents and Running Workflows.
Gauges and graphs are displayed on the right hand side of the window. They provide cumulative statistics about Resolve Actions Express's performance.
Open Incidents
Understanding the Open Incidents List
The following figure shows the Open Incident list.
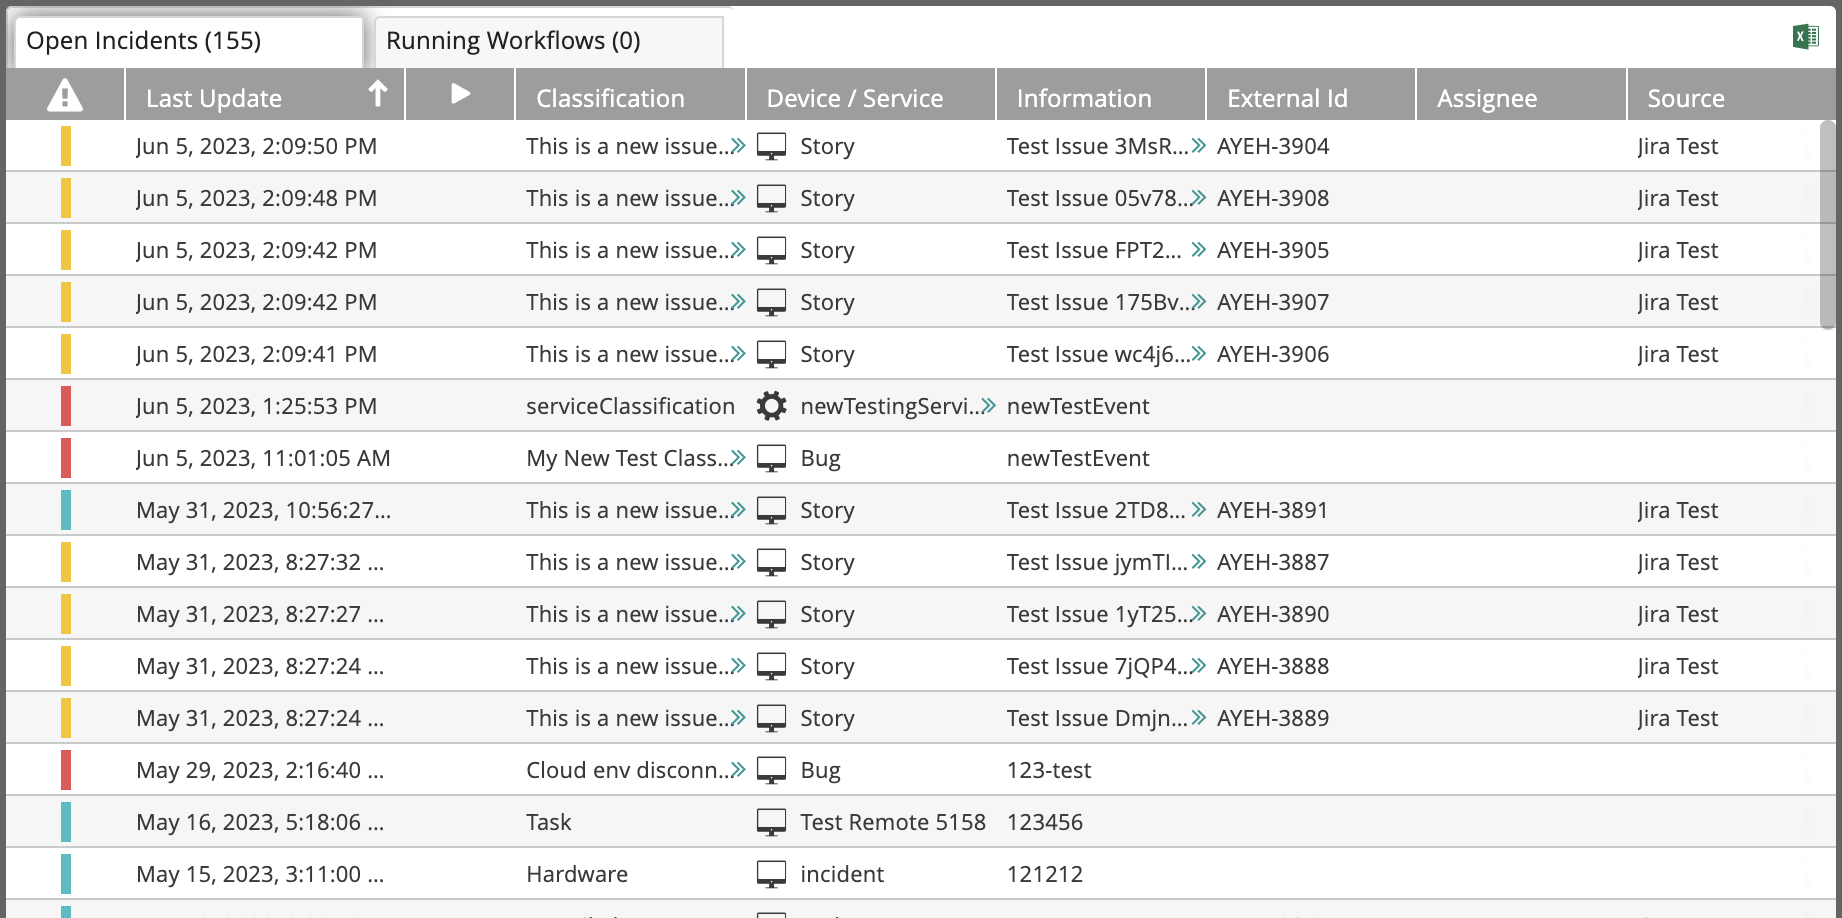
The following table explains the list columns:
| Column | Description |
|---|---|
| Severity of the incident (red=critical, yellow=major, blue=minor) | |
| Last Update | Last update date and time |
| An indication of a trigger (workflows which were triggered by an incoming event are indicated by this). | |
| Classification | Incident classification |
| Device/Service | The incident originates from this device or service |
| Information | Incident description |
| External Id | For incidents that are parsed using the Event Parsing mechanism or created using the New Incident activity, the external ID is created automatically. For incidents that were created by mapping (using one of the built-in integrations), the external ID is the value mapped by Actions Express into the module configuration. It is an internal procedure that assigns a unique ID to every incident. Example: If the integration is a ticketing system, the external ID can be mapped to the ticket ID. By doing so, every time a new ticket is created, a new incident will also be created regardless of the Device/Service and Classification combination. |
| Assignee | The user assigned to handle the incident |
| Source | The source (for example: any of the integration modules) |
Managing Open Incidents
To choose an open incident for management, click anywhere in its line in the list. Notice that a three-dot menu appears at its right end. Clicking it opens an actions list.
The same actions can be accessed from the icons on the top right of the Open Incidents list:
![]()
The icons operate on the selected open incident. Their use is described in the following table:
| Icon | Description |
|---|---|
| Assign the incident to another user | |
| Take ownership of the incident | |
| Stop the assigned workflow | |
| Start the assigned workflow | |
| Open the incident in the Audit Trail | |
| Open in the Incident History | |
| Close the incident | |
| Reset the incident | |
| Export the incident to an Excel file |
Assigning the Incident to Another User
To assign an incident to another user:
- Click the Assign to icon.
The Assign to dialog box opens. - Select the User to which the incident will be assigned.
Choose an existing user by selecting a user from the drop-down list. You can also search for a user by typing part of the user name. Having selected a user, you can edit the entry by clicking the pencil icon. Click the plus icon to add a new user. - Select the Communication method.
The choices are Email or SMS. - Select the Template of the message that will be sent to the user.
Choose an existing message template by selecting a template from the drop-down list. You can also search for a template by typing part of its title. Having selected a template, you can edit the entry by clicking the pencil icon. Click the plus icon to create a new message template. Message templates are created and managed in Understanding Message Templates. - Enter the number of minutes within which the assigned user must respond (Timeout) and click OK.
Taking Ownership of the Incident
Clicking this icon opens the Take Ownership dialog box:

- Select the Communication method. The choices are Email or SMS.
Starting the Assigned Workflow
Clicking this icon opens the Start Workflow dialog box.
To start the assigned workflow:
- Select the Workflow name. note
Once variables have been set (see Setting Variables in Workflows), selecting the workflow from the Workflow dropdown will display the Set Values & Run window. Users with editing permissions have the option to select which variables to be used during the workflow execution while users without editing permissions must insert values for all of the required variables to execute the workflow.
- Select one of the available options:
- Move to Audit Trail: After running the workflow, the Audit Trail window opens so that you can watch its progress.
- Stay in current: After running the workflow, you remain in the current Workflows window. Use this option to concurrently run several workflows.
Opening Incidents Gauges
The gauges and graphs display the relevant information according to the selected period. Use the Time Frame drop-down list to select it.
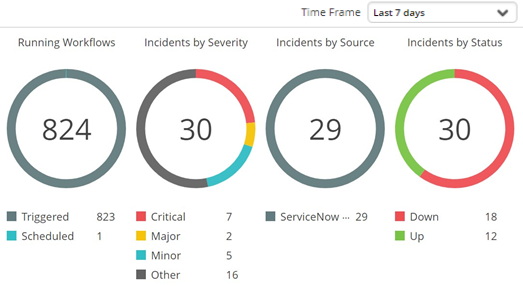
The top section shown above displays the running workflows (segmented by trigger/schedule), incidents (segmented by severity), incidents (segmented by source and by status):
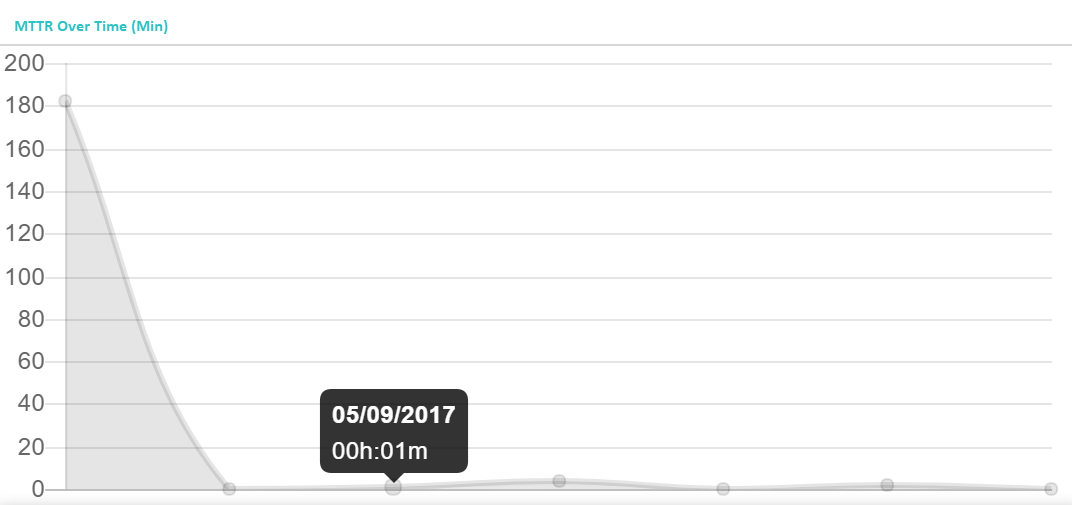
The MTTR Over time graph displays the mean time to recover at different points in time, according to the selected time frame.
Hovering over an individual point will display the specific date and time of the measurement.
For example, in the following illustration the selected time frame is Last 7 days and the points on the horizontal axis represents days.
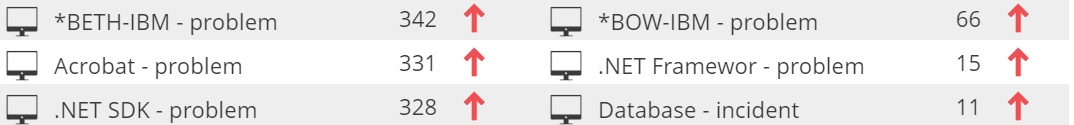
Below the MTTR Over Time graph is a list of incidents in respect of which the MTTR was the highest (within the selected time frame). The arrow symbol next to each incident name indicates whether the MTTR increased or decreased (compared to the previous period). In the illustrated example, the MTTR of the displayed incidents was higher than the MTTR in the preceded period:
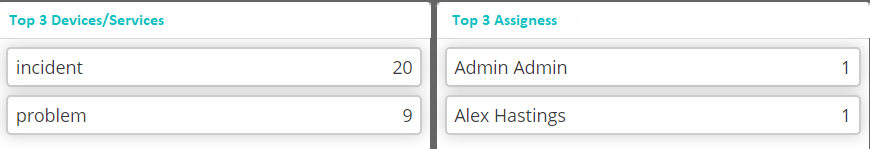
The bottom section displays the most common devices and services that were involved in the incidents, and the most common assignees (in the selected time frame):
Running Workflows
Understanding the Running Workflows List
The Running Workflows tab shows what workflows are running at the moment you are viewing the list.

The following table explains the list columns.
| Column | Description |
|---|---|
| Start Time | The workflow's starting time |
| Workflow Name | The workflow's name |
| Policy Type & Name | The policy type - indicates whether the workflow was triggered by an event or scheduled |
| Current Activity | Workflow activity being currently performed |
| Running Time | Workflow running duration |
| Source | Indicates how the workflow was invoked - manually or from another workflow activity |
Managing the Running Workflows
To choose a running workflow for management, click anywhere in its line in the list. Notice that a three-dot menu appears at its right end. Clicking it opens an actions list.
The Running Workflows action icons are described in the following table.
| Menu item | Description |
|---|---|
| Stop the workflow | |
| Open the workflow in the Workflow Designer | |
| Open in the Repository | |
| Open in the Audit Trail |
Running Workflows Gauges
The gauges and graphs display the relevant information according to the selected period. Use the Time Frame drop-down list to select it.
The Workflows Over time graph displays the duration of running workflows at different points in time, according to the selected time frame.
Hovering over an individual point will display the specific date and time of the measurement.
For example, in the following illustration the selected time frame is Last 7 days, and the points on the horizontal axis represents days.

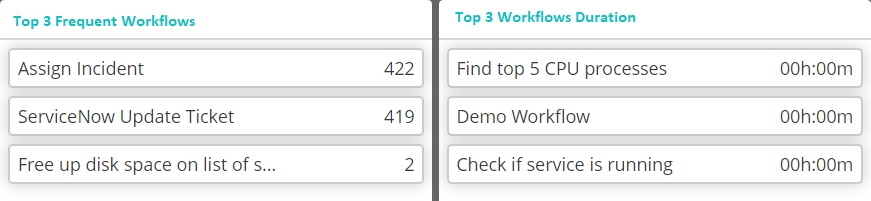
Below the Workflows Over Time graph is a list of the most frequently run workflows. The counts shown are the number of times the workflow has been run during the defined time period. The arrow symbol next to the count indicates whether the number of times the workflow has been run during the current period increased or decreased compared to the preceding period. In the above example, the counts of all workflows were higher than in the preceding period:
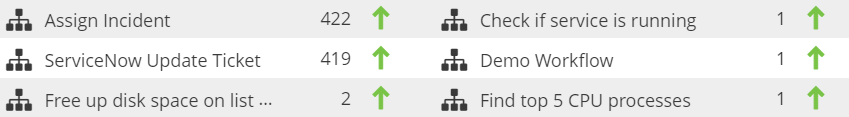
The bottom section displays the most frequent workflows and the workflows of which the duration was the longest (in the selected time frame):